
Author, Maeve Mulholland
Director of Artificial Intelligence
Enabling Effective Threat Detection Through Data Science
SnapAttack is all about threat detection engineering and bringing red and blue teams together. We empower users to find, create, test, share, and deploy the best analytics. We make sharing offensive tactics simple, memorializing red team activity with logging and video capture. We are passionate about making purple teaming efficient and effective.
For those that know us, our love of threat hunting is obvious, but what may not be so obvious is our obsession with data and how critical data management and data science are to our mission. Bringing action and context to the way we activate data allows us to manage, analyze, and curate detections in ways that remove barriers and simplify clunky processes for security teams. We want to share some of those perspectives and how they help us structure and interact with data.
Learn more about leveraging data science in threat hunting in our recent blog: Utilizing AI in Cybersecurity: Top Trends for Enterprises in 2022
Example: Shifting Perspective on Detection Analytics
For example, we treat detections like code — it’s not just a hot marketing phrase. We maintain versioning for each detection, providing traceability of changes as each one is refined. The detections live as abstract instructions in the form of Sigma YAML files and then are compiled (just like code) for different SIEM/EDR and query syntaxes. We applied a CI/CD framework to our detections.
SnapAttack feeds each detection into a testing and evaluation pipeline that is applied automatically and continuously with each variation so we can identify and highlight syntax and compilation errors at the time of creation. Also, because IDE’s seem to work so well for coding in general, we built a special purpose, no-code IDE for detection development.
Want to learn more about Detection-as-Code? Check out our webinar replay: Breaking Barriers with Detection-as-Code
Lists and Tables and DB’s, Oh My!
This perspective on detections is critical. SnapAttack could not exist without it. However, behind the scenes there is even more going on. We also have to manage and analyze the interactions between the detections and the attack sessions in the platform. This is a complicated problem that requires a creative solution.
Each attack session has a full set of logs, various tags associated with it, and a number of “red markers” that tell us where the attack technique or exploit occurred during the attack session. The detections have tags, log source information, fields used, etc. Since each analytic query is run on every set of attack session logs, there is a list of query hits for every analytic-attack pair.
Learn more about threat-informed defense in our eBook: Are we protected? Mobilizing threat-informed defense through continuous purple teaming
How does one make sense of all that data? It is too much to plop in front of a user and say “have at it”? In the UI, we present small bites of that data, focusing on a particular detection or attack session and a selection of important connections to others. We let the user filter on various criteria to aid in choosing detections or studying attack sessions.
Still, getting a wide-angle view of the data remains a bit tricky. We have tried out a few different structures to the data, and we found a point of view that intuitively shows the interaction between the attack sessions and the detections — graphs (also called networks, but we’ll avoid that terminology so as to avoid confusion with IT networks).
As many proponents of graph data structures will tell you, this is a dramatic departure from the way one traditionally handles data. At first, we were thinking of the data as a series of lists — a list for detection attributes, a list for attack attributes, a list of log lines for each detection-attack pair, a list of malicious time and process markers for each session, and so forth. Trying to join and filter on all these tables is less than intuitive (see the mess below).
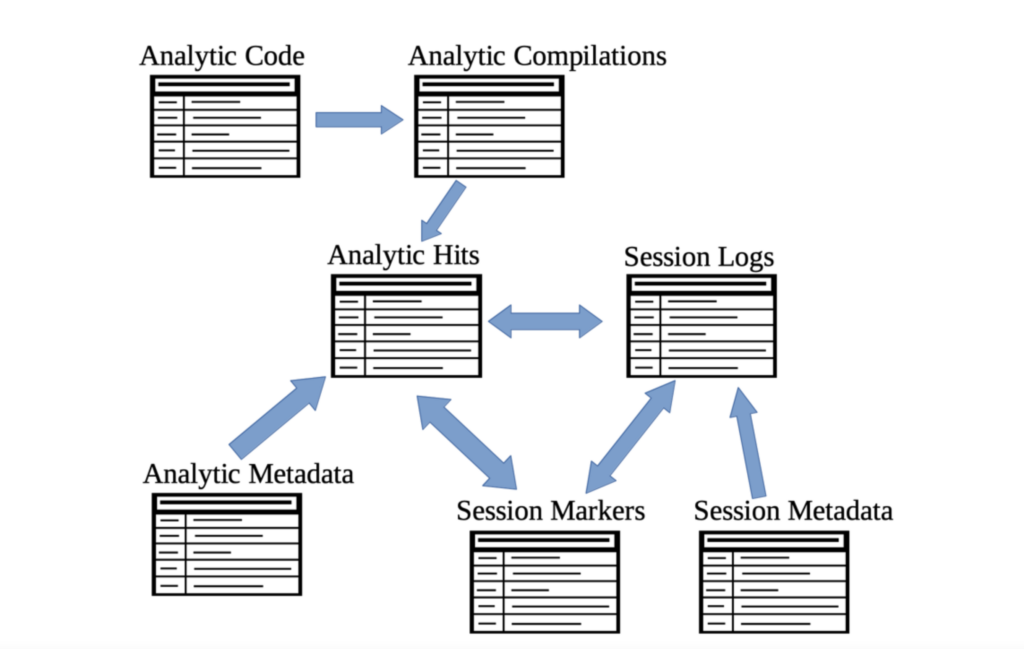
Joining a collection of tables in various ways in order to get a big-picture view of the data is unwieldy, and in the end, you just get a big complicated list that is hard to decipher.
The advantages graphs have over a list view was emphasized by John Lambert in an excellent blog post where he points out that “[The] biggest problem with network defense is that defenders think in lists. Attackers think in graphs. As long as this is true, attackers win.” While he was making a point specifically about network defense, the point generalizes. Holistic thinking is extremely powerful, and graphs are an entry point into that way of thinking.
Graphs to the Rescue
Take a look below at a graph representing the connections between these data tables. Despite looking simple, a graph can hold a lot of complex data and represent meaningful interactions between data. The below example organizes and provides a conceptual framework for the connection between a threat detection and an attack session.
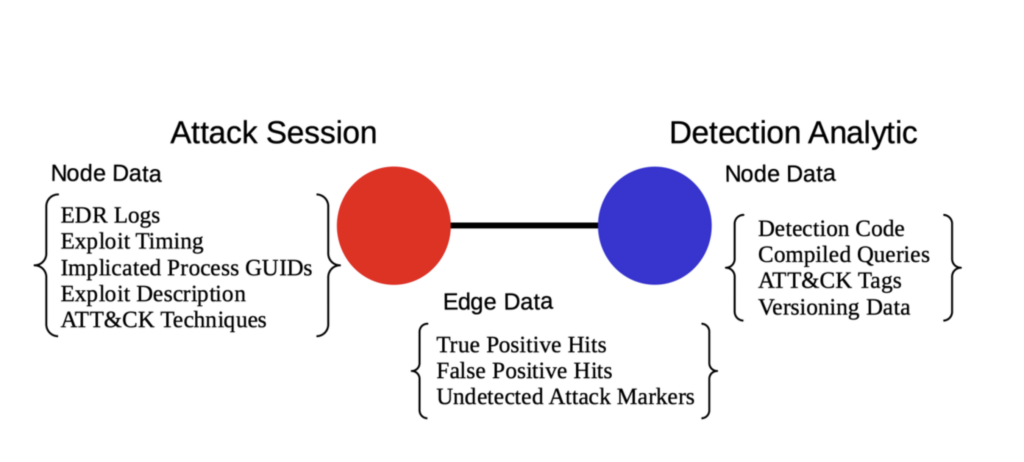
A conceptual unit in our graph that ties together data from multiple tables
There are two types of nodes in our graph data structure: blue ones for threat detections and red ones for attack sessions. We store the attributes for a detection in its own unique node and likewise for the attack session. If a detection query hits a log from an attack session, we connect the two with an edge or line. That edge is where we store the details regarding log hits — how many log ids, which ones are validated, and anything else relevant to the interaction between that detection and attack.
So instead of a bunch of tables, we now have a natural method to break down the data associated with the detections, attacks, and the interactions.
For a renewed perspective on threat detection, check out our webinar replay: The Art + Science of Pre-Crime Threat Hunting
LSASS Credential Dumping Case Study
Next, we’ll build a bigger graph and see what benefits it provides. One can conduct several sophisticated analyses with graph data, but simply filtering on MITRE ATT&CK techniques provides a useful visualization. In the graph below, we have the three attack sessions associated with MITRE ATT&CK Subtechnique T1003.001. Shown connected below as blue nodes are the detection analytics that hit on logs in the attack sessions and were confirmed to be good hits.
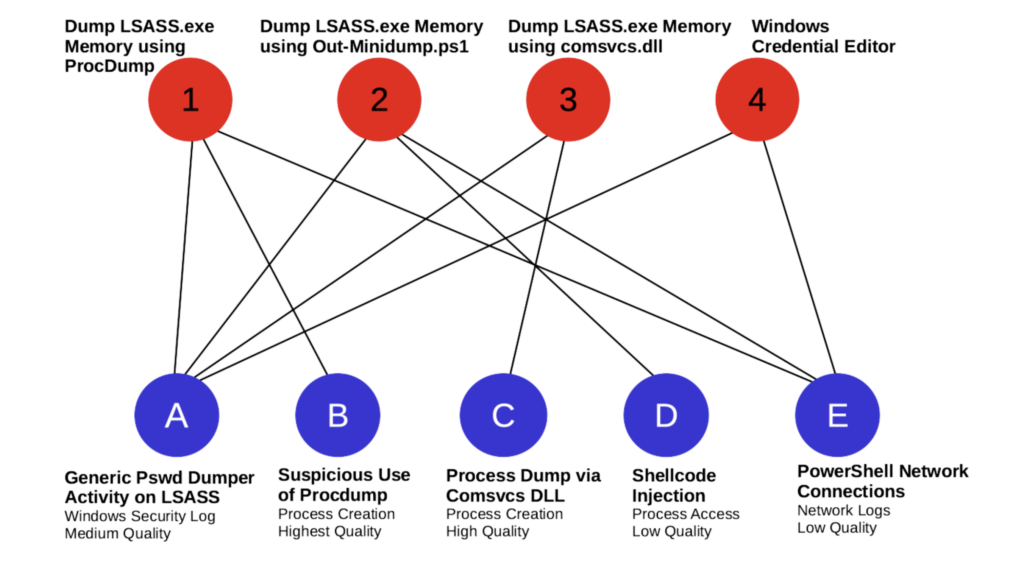
Graph Data for ATT&CK Technique T1003.001 OS Credential Dumping: LSASS Memory
Open source platform contents (Atomic Red Team and Sigma) under the T1003.001 umbrella are captured by this graphic. There are four attack sessions and five detections that catch at least one of those attacks. Which of these detections would a blue teamer want to deploy? There is no single correct answer to that question, but this graphic can help one sort through the possibilities quickly. First of all, Detection A covers all of the attack sessions. One possibility would be to choose Detection A and call it a day, however there are some potential downsides to that strategy.
Detection A is only medium quality. It hits all four attack sessions whereas the other detections are more focused, with B, C, and D hitting on only one attack session each. Detection E hits on three. Just by glancing at the graph, one can immediately see that there is a trade-off between the number of queries one has to deploy and detection specificity. Do we want fewer queries with wide nets, or do we want lots of very targeted queries?
Achieve a proactive cybersecurity posture with our recent webinar: Demystifying the Tradecraft of Threat-Informed Defense
Attack Session and Detection Analytic Links
- Session 1: Dump LSASS.exe Memory using ProcDump source
- Session 2: Dump LSASS.exe Memory using Out-Minidump.ps1 source
- Session 3: Dump LSASS.exe Memory using comsvcs.dll source
- Session 4: Windows Credential Editor source
- Detection A: Generic Password Dumper Activity on LSASS source
- Detection B: Suspicious Use of Procdump source
- Detection C: Process Dump via Comsvcs DLL source
- Detection D: Shellcode Injection source
- Detection E: PowerShell Network Connections source
The graph brings into view another feature of a detection ensemble — defense-in-depth. Detections B and C both use process creation event logs, D uses process access events, E uses network logs, and A needs specifically Windows Security Log events. Detections that rely on different data types can complement one another and provide corroboration that an alert should be inspected by an analyst. It is possible that an attacker covers their tracks in one log, whereas their footprints remain in another log type. Detection A overlaps with both B, C and D, but since they detect the same kind of behavior from different angles, it may be worthwhile to keep all three of them.
Detection E is kind of the odd-detection-out. It checks the network logs for signs of a download over PowerShell, which is hardly a high fidelity detection. The platform is also telling us that it is low quality. A probable decision here is to simply discard it.
The ATT&CK technique sub-graph is very versatile, and much more information can be conveyed visually and intuitively than in any flattened data table. There are more sophisticated graph analysis techniques that can be used to reveal further insights into the collection of detections and attack sessions. One can use graph projections to extract similarity measures. These similarity measures between detections can be used to curate the repository and deduplicate detections. The similarity measures can also be used to collect complementary detections for developing a defense-in-depth approach to detection. Additionally, graph neighborhoods and subgraph analyses can show gaps in the detection and session coverage that need to be addressed.
Graphs, Graphs Everywhere
The goal of this post was to show the power of graph analysis and how the data on SnapAttack lends itself to a graph treatment. The complex series of related data tables detailing the interaction of attack sessions and detections can be stored in a much simpler graph data structure. Without needing additional sophisticated analysis, these data structures can then be used as decision making tools, as in our LSASS credential dumping example.
I’ll show more sophisticated analyses in future blog posts. Graph analysis is an extremely rich field with applications stretching over lots of different domains to draw inspiration from. The graph-based PageRank algorithm changed the way people use the internet. Marketing research relies on graph analysis for discovering interest groups in social network data. Cyber security researchers are using graphs in a variety of ways such as IDS alert processing. There is a lot of value in the graph analysis toolbox, and I recommend thinking about how you might reimagine your datasets in order to make use of some of those tools. In the next blog post I’ll demonstrate some of the more sophisticated graph work going on at SnapAttack.
SnapAttack was built by CISOs, SOC leaders, and threat hunters for CISOS, SOC leaders, and threat hunters.
By rolling intel, adversary emulation, detection engineering, threat hunting, and purple teaming into a single, easy-to-use product with a no-code interface, SnapAttack enables you to get more from your technologies, more from your teams, and makes staying ahead of the threat not only possible – but also achievable.
Schedule a demo today to see how you can finally answer the question, “Are we protected?” with confidence.